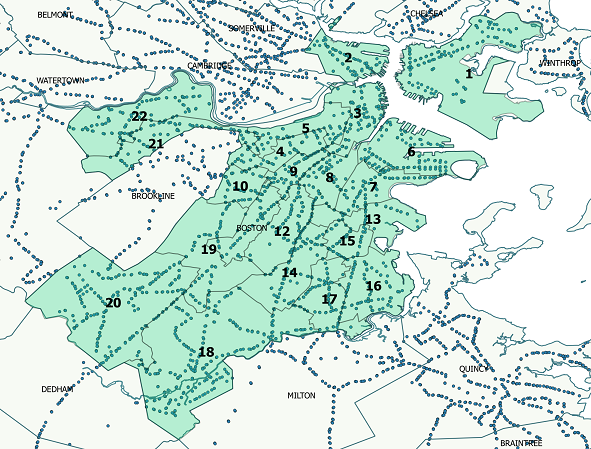
This network graph represents bus routes that connect wards in Boston. Each node represents one of 22 wards in the city of Boston. The links represent a connection that can be made to another ward without a transfer. Each node is sized based on the population in that ward, and colored according to the number of total bus stops in the ward. The links are weighted according to the number of unique routes that connect the wards.
.The data for this network is created from the MBTA route schedule, and stop locations, and the shapefiles that describe the ward boundaries and population statistics. We refer to this type of network as a ‘hairball’ – and motivates the search for better representations of networks. The fully represented network contains 22 nodes and 180 links.
A tmap of Boston Wards and bus stops projects data geographically; however, the amount of data projected can quickly overwhelm our ability to understand the connections between the wards.
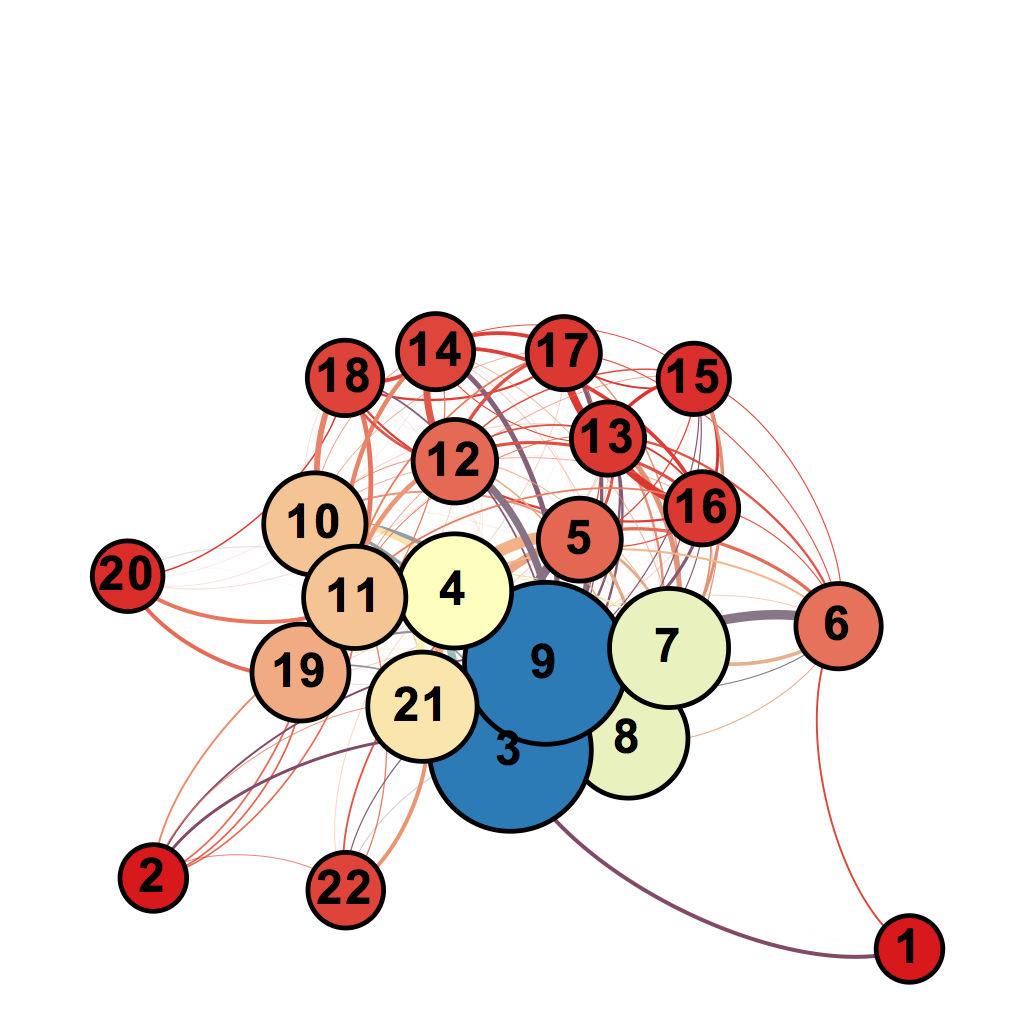
Using the MBTA GTFS data provided by the City of Boston, we were able to construct bus networks revealing the trip connections between different wards. The dataset included all bus stops in the Greater Boston Area. We first focused on stops within the Boston city limits, and using the Boston wards shapefile, placed each stop in its respective ward, Next, using the stop_times.csv file provided in the GTFS data, we could construct a network with each ward represented by a node, and an edge connecting pairs of wards that had a bus route passing between them. The weight of these edges was calculated by the number of distinct trips along the route, found from the stop_times.csv file. We then calculated the modularity classes in the network, to determine highly interconnected wards. Nodes in the below network were sized based on their degree, and colored by modularity class.
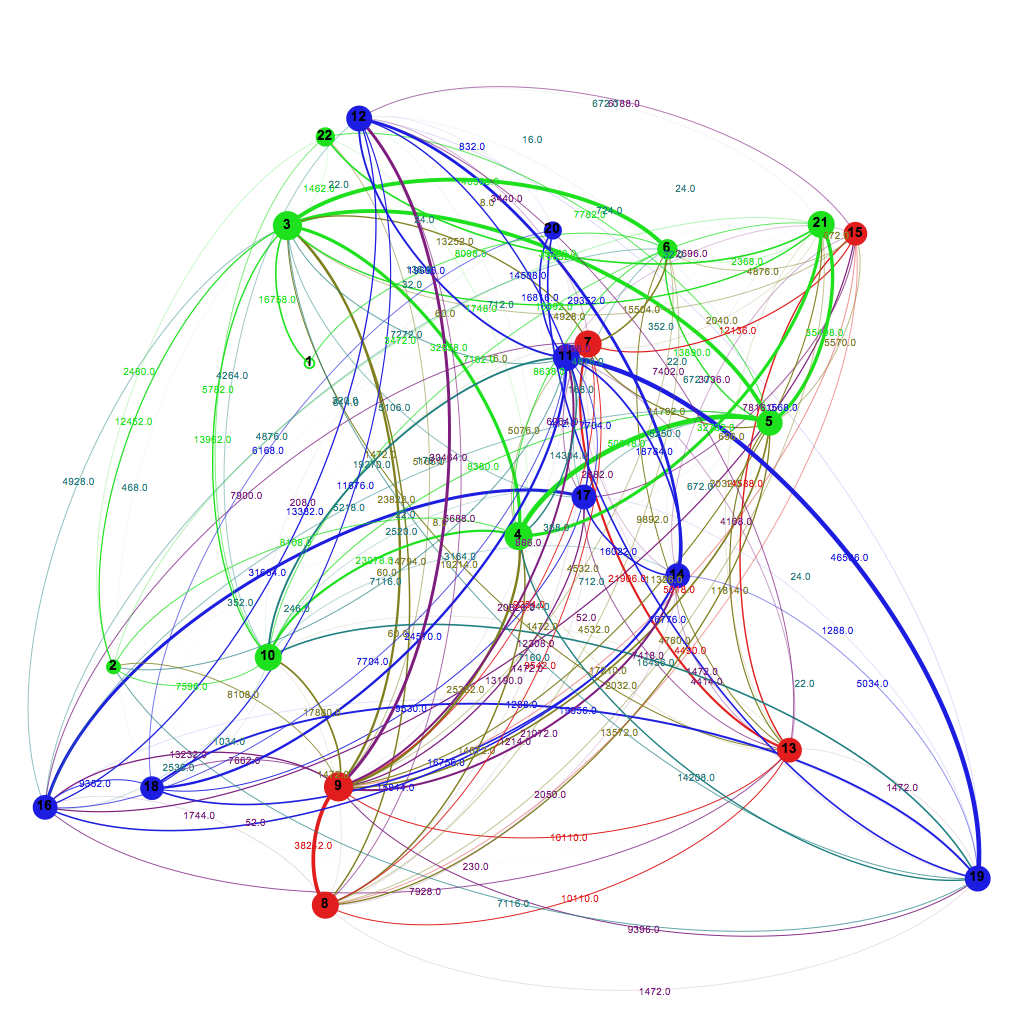
Next, we applied a betweeness centrality analysis to the wards network to determine which wards are most central to the network. Each node is labeled by its respective ward, and sized and colored by betweeness centrality.